我是一直在努力的学习思考并改变自己.
系统拓扑:

安装nginx
安装nginx
1 | [root@localhost ~]# yum install nginx -y |
修改其配置文件,将nginx日志格式转换为json格式
1 | http { |
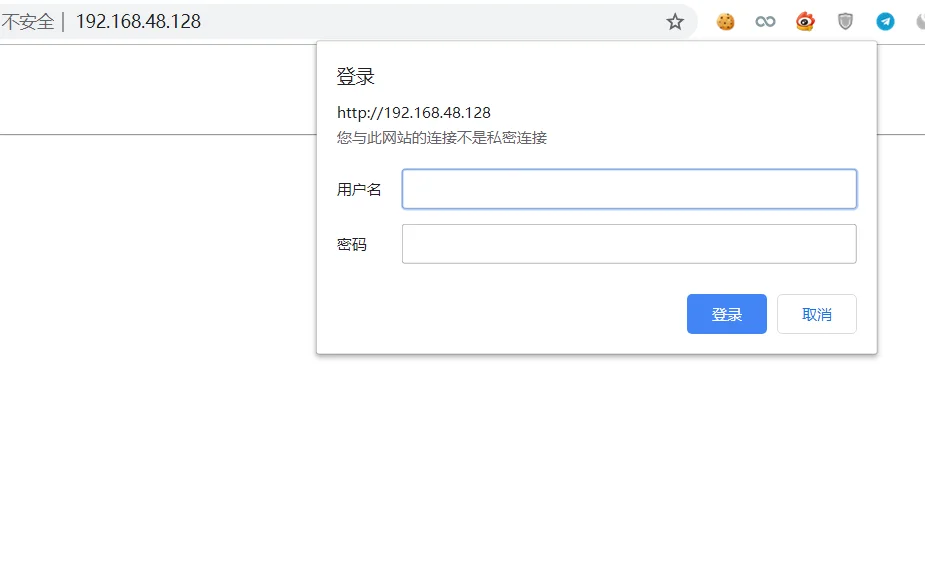
设置nginx认证
设置nginx必须使用用户名密码方式验证,修改配置文件
1 | location / { |
接着去创建一个passwd,写入用户名密码
1 | [root@localhost conf.d]# touch passwd |
但如果明文写入其中的话,并不安全,所以需要加密,我们使用openssl软件进行加密.OpenSSL是一个强大的安全套接字层密码库,参数passwd表示生成散列密码,-apr1表示基于 MD5 的密码算法, 为Apache 变异加密,而且相同的值每次所计算的结果均不一样
1 | [root@localhost conf.d]# openssl passwd -apr1 123456 |
写入内容为:
1 | admin:$apr1$VSksFdhI$lU3M4V2wRPJ9qaTzYrDeX/ |
重启nginx
1 | [root@localhost nginx]# systemctl restart nginx |
再次访问的话就需要输入用户名密码才可以打开nginx界面
部署filebeat
下载filebeat
1 | [root@localhost local]# wget https://artifacts.elastic.co/downloads/beats/filebeat/filebeat-6.6.2-linux-x86_64.tar.gz |
解压缩
1 | [root@localhost local]# tar zxvf filebeat-6.6.2-linux-x86_64.tar.gz |
修改其配置文件
1 | [root@localhost local]# cd filebeat-6.6.2-linux-x86_64/ |
搭建redis缓存服务器
下载
1 | [root@localhost local]# wget http://download.redis.io/releases/redis-4.0.14.tar.gz |
解压
1 | [root@localhost local]# tar zxvf redis-4.0.14.tar.gz |
编译
1 | [root@localhost redis-4.0.14]# make |
如果出现以下报错
1 | [root@localhost redis-4.0.14]# make |
输入
1 | make MALLOC=libc |
接着在进行编译即可
初始化redis
1 | [root@localhost redis-4.0.14]# cd utils/ |
如果出现以下问题
1 | [root@localhost utils]# ./install_server.sh |
那么就去创建软连接,将redis-server的软链接创建到/usr/local/bin下
1 | [root@localhost src]# ln -s /usr/local/redis-4.0.14/src/redis-server /usr/local/bin/ |
接着去修改redis配置文件
1 | [root@localhost utils]# vim /etc/redis/6379.conf |
开启redis
1 | [root@localhost utils]# systemctl restart redis_6379 |
将redis-cli添加到/usr/local/bin目录下,然后启动redis-cli客户端
1 | [root@localhost src]# ln -s /usr/local/redis-4.0.14/src/redis-cli /usr/local/bin/ |
同步系统时间,这里与阿里的ntp服务器进行同步
ntp1.aliyun.com ~ ntp5.aliyun.com这几个ntp服务器都可以使用的
1 | [root@localhost config]# ntpdate ntp1.aliyun.com #进行同步 |
修改logstash配置文件
修改logstash配置文件,使用logstash-input-redis插件
1 | [root@localhost config]# vim logstash.conf |
启动logstash
1 | [root@localhost config]# ../bin/logstash -f logstash.conf |
启动filebeat
1 | [root@localhost filebeat]# ./filebeat -e -c filebeat.yml |
当logstash无法使用的时候,数据会保存到redis中,一旦logstash可以正常使用的时候,会将redis的数据取出进行数据过滤展示在kibana中
部署elasticsearch集群
修改其配置文件
1 | #检查两台主机的集群名是否一致,若不一致,则无法加入统一集群中 |
设置主节点资格并互相连接的节点最小数目,如果不做这种设置,遭受网络故障的集群就有可能将集群分为两个独立的集群,成为脑裂,计算公式为:对于n个节点来说,则就取(10/n)+1的值
1 | discovery.zen.minimum_master_nodes: 2 |
配置主节点和数据节点
1 | node.master: true #成为主节点 |
另一台主机的配置
1 | cluster.name: my-cluster |
检测是否成功
1 | [root@localhost ~]# curl http://192.168.48.129:9200 |
成功安装,查看集群查询健康状态(设置的pretty=true参数表示以便于查看的形式显示):
1 | http://192.168.48.129:9200/_cluster/health?pretty=true |
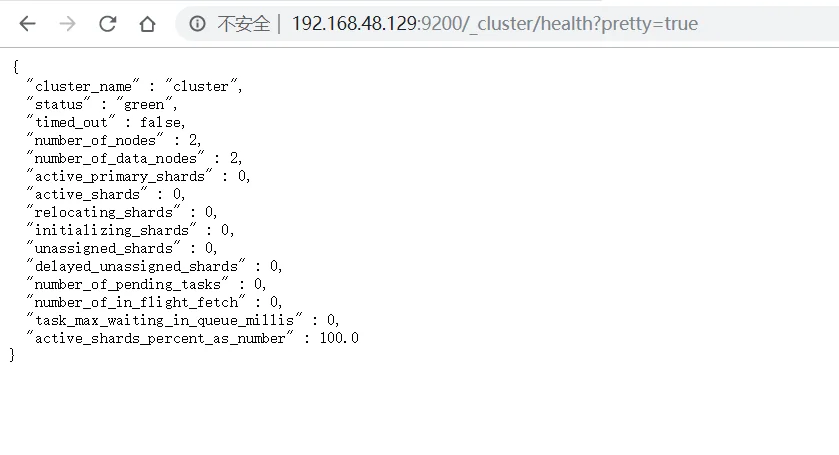
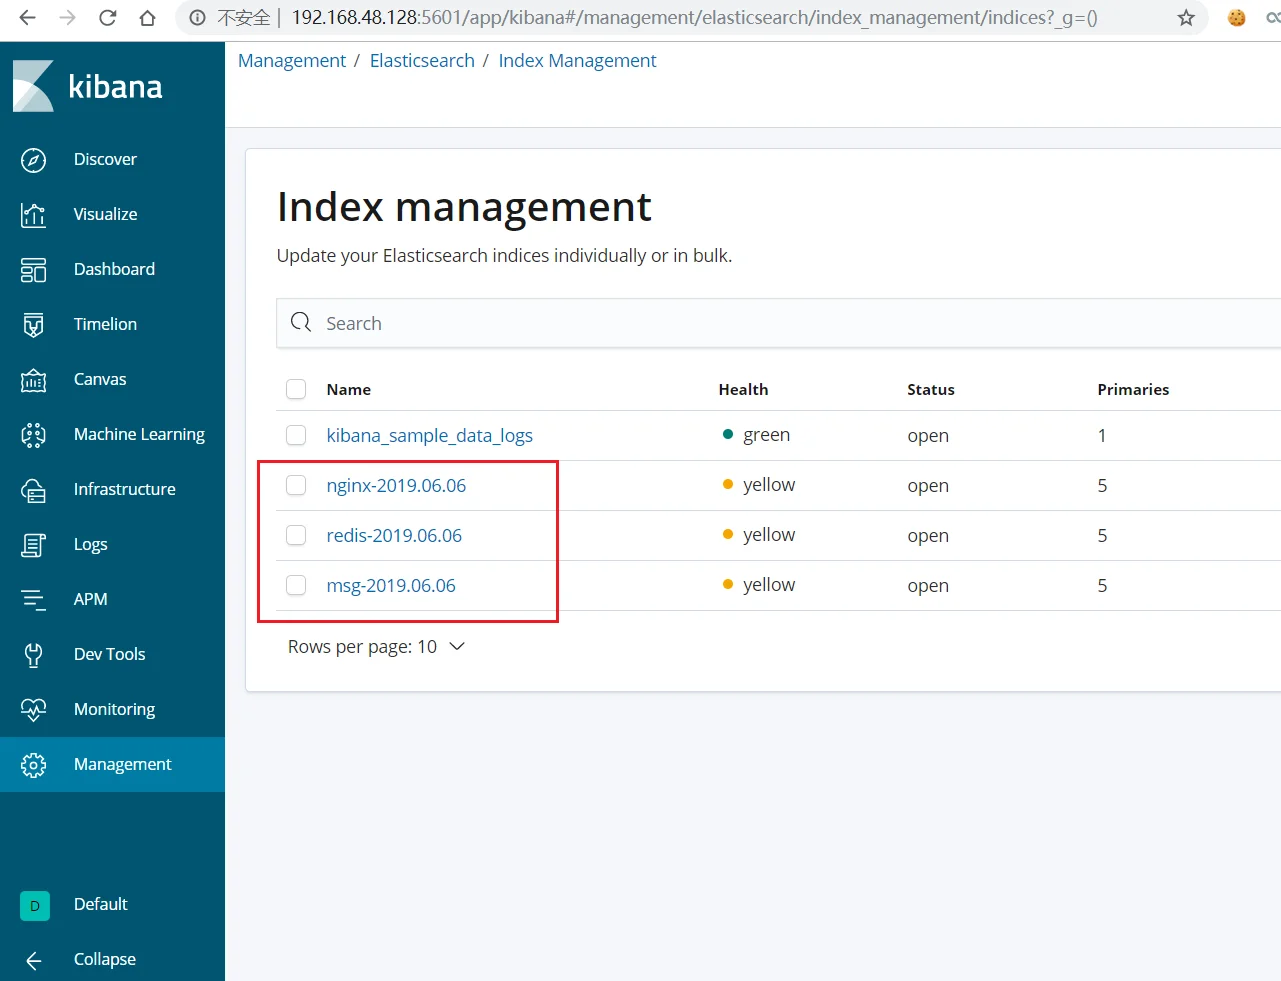
其状态有三种情况
green:表示所有主分片和副本分片都处于活动状态
yellow:表示所有的主分片都处于活动状态,非所有副本状态处于活动状态
red:表示不是所有的主分片都处于活动状态
编辑kibana配置文件
修改kibana配置文件,设置连接主机为集群中的两台主机
1 | elasticsearch.hosts: ["http://192.168.48.129:9200","http://192.168.48.130"] |
集群的状态查询
1 | http://192.168.48.129:9200/_cluster/state?pretty=true |

查看节点信息
1 | http://192.168.48.129:9200/_nodes?pretty=true |

安装ik中文分词器
简介:
1 | IKAnalyzer是一个开源的,基于java语言开发的轻量级的中文分词工具包。 |
下载IK中文分词器
1 | wget https://github.com/medcl/elasticsearch-analysis-ik/releases/download/v6.6.2/elasticsearch-analysis-ik-6.6.2.zip |
然后在elasticsearch目录下的plugins下创建目录ik,将IK中文分词器在该目录下解压
1 | [elk@localhost ik]$ ls |
接下来重启elasticsearch,然后在开发者工具下设置
创建一个索引
1 | PUT /my_ik |
创建个映射
1 | POST /my_ik/fulltext/_mapping |
插入四组内容
1 | POST /my_ik/fulltext/1 |
查询content中带有中国的数据
1 | GET /my_ik/fulltext/_search |
设置搜索结果高亮显示
1 | GET /fxik/fulltext/_search |
使用ik_max_word分词器对内容进行分词
1 | GET /my_ik/_analyze |
使用标准分词器对内容进行分词.其是将每个字符都作为关键字
1 | GET /fxik/_analyze |
依次重启各个服务
对elasticsearch进行基本的搜索
查询elasticsearch中所有信息
1 | GET _search |
创建一个索引
1 | PUT /class |
向索引添加一条内容
1 | POST /fxclass/student/1 |
获取该索引的内容
1 | GET /class/_search |
根据字段的关键字进行搜索
1 | GET /class/_search |
实现报表分析
因为没有数据,所以我们去下载范例进行操作
1 | wget https://download.elastic.co/demos/kibana/gettingstarted/accounts.zip |
解压,然后将该文件加载到elasticsearch中
1 | [root@localhost local]# curl -H 'Content-Type: application/x-ndjson' -XPOST 'localhost:9200/bank/account/_bulk?pretty' --data-binary @accounts.json |
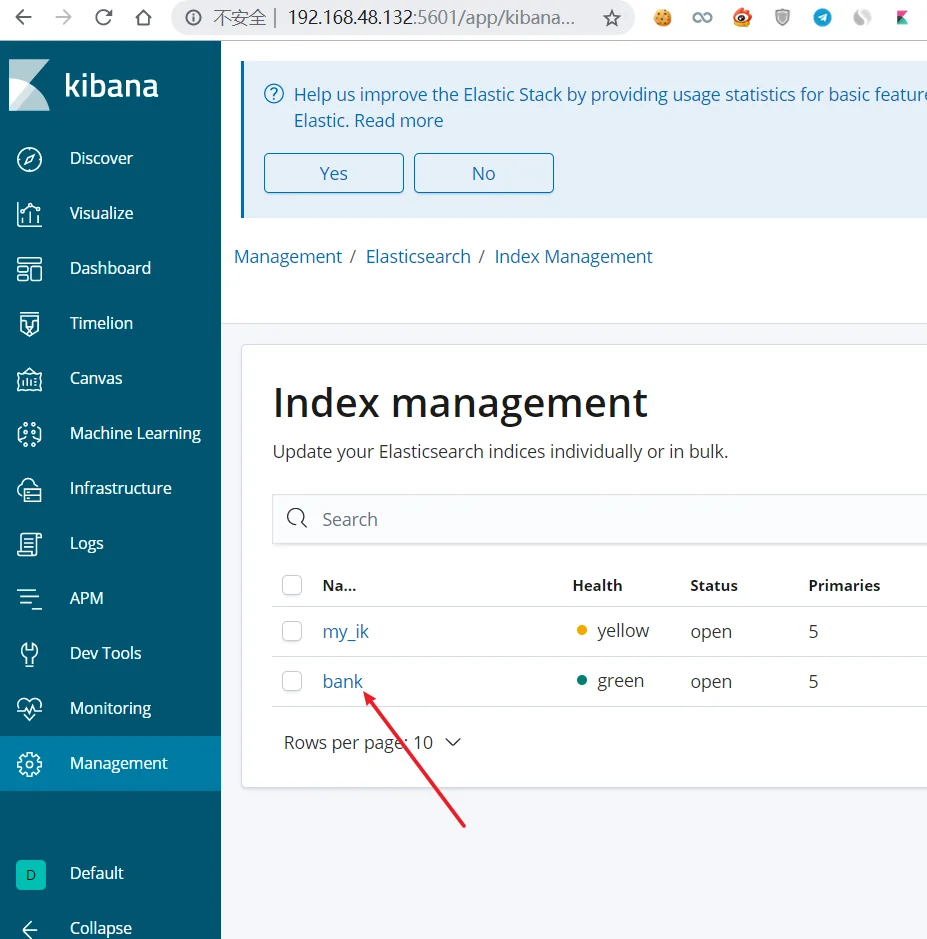
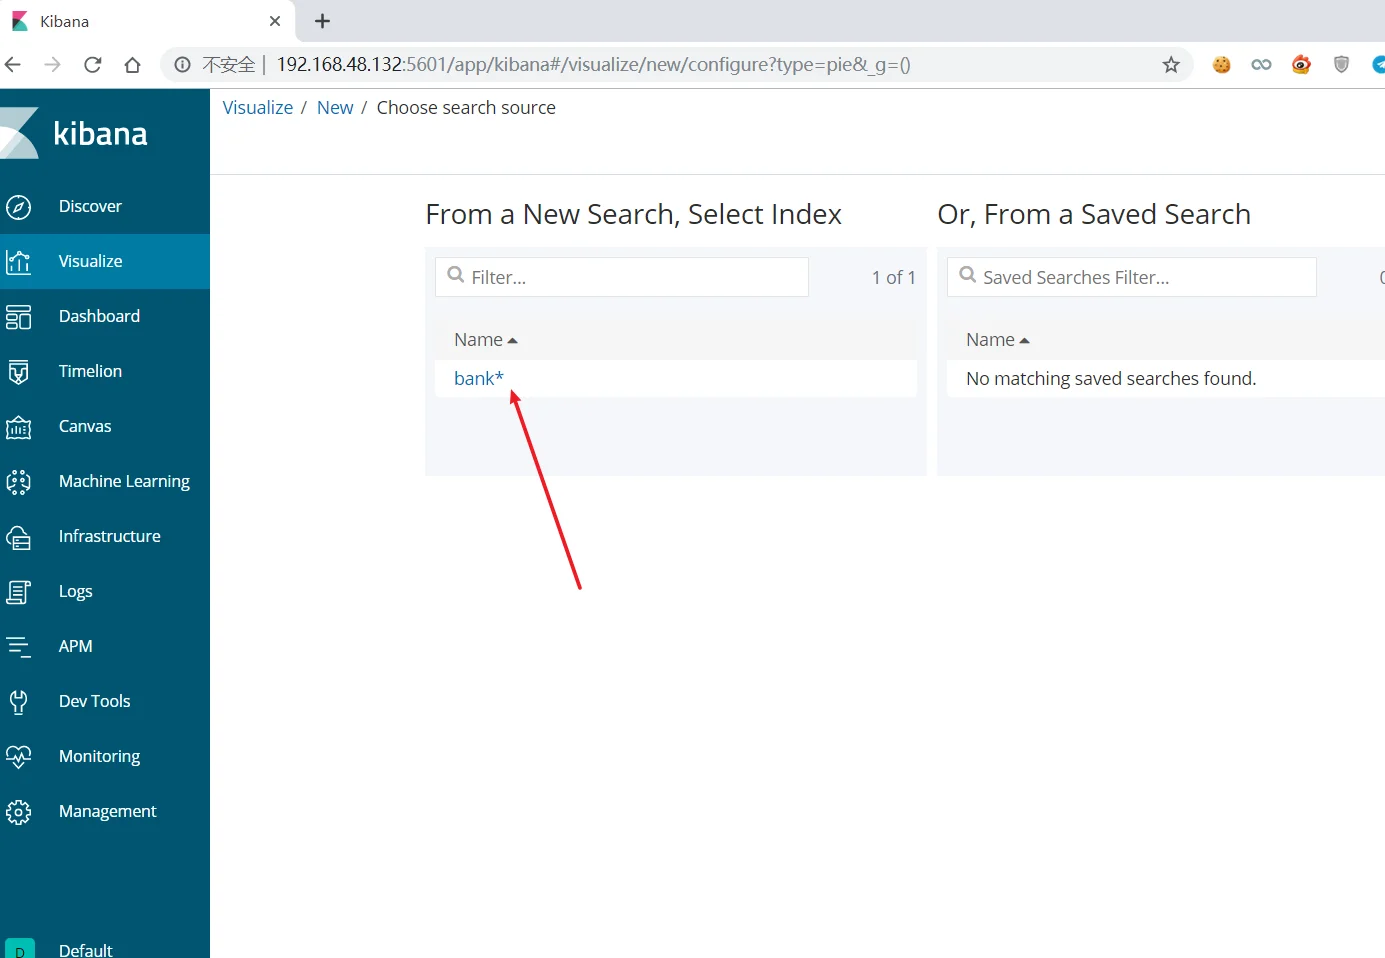
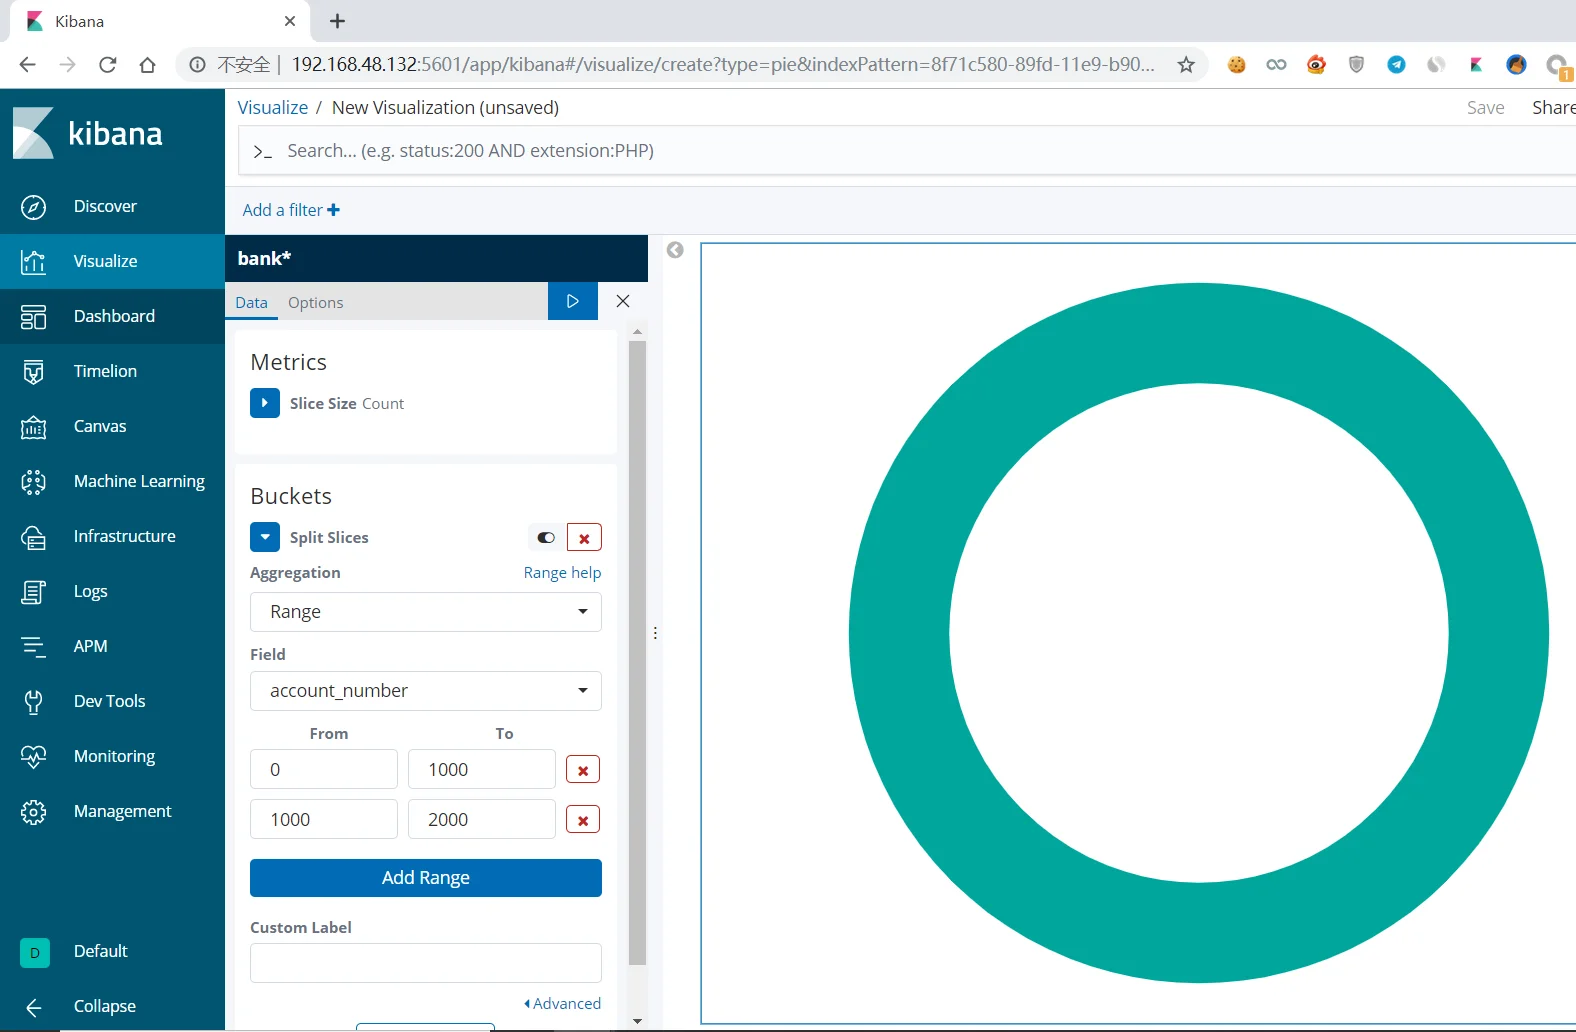
进行报表分析,建立pattern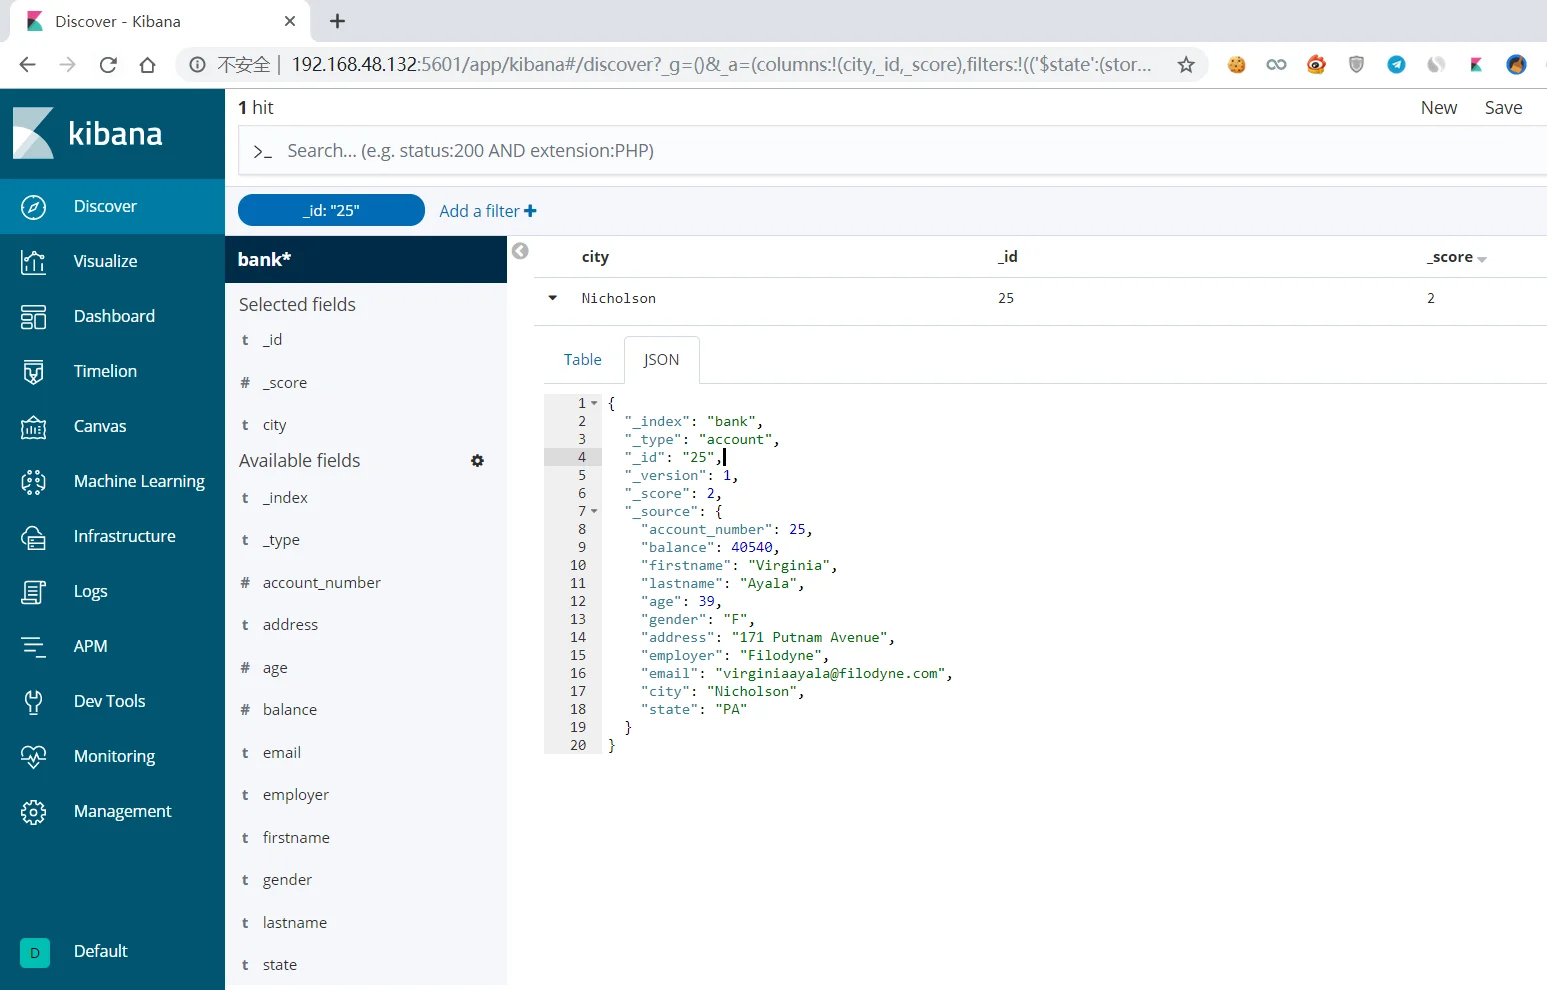
创建可视化界面,使用模板创建